
China-EU Export & Import Scale Up in Jan-July 2016
[2016-10-09]
According to China Customs statistics, in January-July 2016, the export-import value between China and the EU totaled CNY 2 trillion, up 1.8% year-on-year (YOY), accounting for 15.2% of China's gross export-import value. Therein, China’s export reached CNY 1.2 trillion, up 1.7% YOY; China’s import reached CNY 771.6 billion, up 2.1% YOY; trade surplus expanded by 1% YOY to CNY 465.5 billion.
Ⅰ China-EU Export & Import Characteristics in July
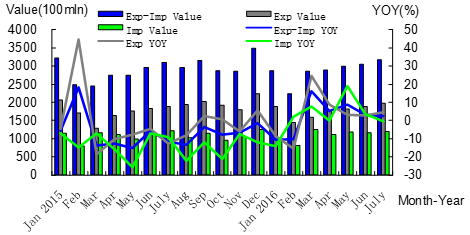
(1) Export and import upward in July as the fifth consecutive month. In July, export and import totaled 317.65 billion yuan, up 2.5% YOY, up 4.1% MOM; export to the EU reached 197.4 billion yuan, up 4.3% YOY, up 4.9% MOM; import from the EU reached 120.25 billion yuan, down 0.5% YOY, up 2.7% MOM ( see the following chart).
Ⅰ China-EU Export & Import Characteristics in July
(1) Export and import upward in July as the fifth consecutive month. In July, export and import totaled 317.65 billion yuan, up 2.5% YOY, up 4.1% MOM; export to the EU reached 197.4 billion yuan, up 4.3% YOY, up 4.9% MOM; import from the EU reached 120.25 billion yuan, down 0.5% YOY, up 2.7% MOM ( see the following chart).
China-EU Export & Import Trend Monthly, Jan 2015-July 2016
(2) Ordinary trade share made up nearly 70%, processing trade declined. In July, China's ordinary trade with EU reached 210.52 billion yuan, up 5.4% YOY, accounting for 66.3% of the total; processing trade with EU reached 75.08 billion yuan, down 1.7% YOY, accounting for 23.6%; under Customs special control, the export-import value was 26.29 billion yuan, down 0.1% YOY.
(3) Germany was the largest trading partner with China in the European Union. In July, China's export and import with Germany reached 86.96 billion yuan, down 1% YOY; China-UK trade reached 45.38 billion yuan, up 4.3%; China-Netherlands trade reached 37.64 billion yuan, down 0.3%; China-France trade 27.63 billion yuan, down 5.3%; China-Italy trade 23.8 billion yuan, up 0.9%. Along the “Belt and Road”, China’s trade with Poland, the Czech Republic, and Hungary respectively reached 10.04 billion yuan, 5.62 billion yuan and 5 billion yuan, up 14.7%, 10% and 24.2% YOY.
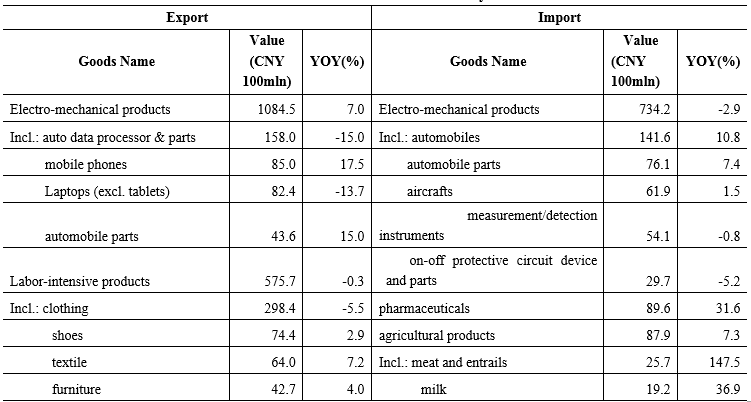
(4) Exports to EU were mainly electro-mechanical and traditional labor-intensive products. In July, China's exports of electro-mechanical products totaled 108.45 billion yuan, up 7% YOY, accounting for 54.9% of total export value, including automatic data processing equipment worth 15.8 billion yuan, down 15%; mobile phones worth 8.5 billion yuan, up 17.5%; laptops worth 8.24 billion yuan, down 13.7%. In addition, traditional labor-intensive products exports totaled 57.57 billion yuan, down 0.3%, accounting for 29.2%; including clothing worth 29.84 billion yuan, down 5.5%; shoes worth 7.44 billion yuan, up 2.9%.
(5) The imports were mainly electro-mechanical products, pharmaceutical imports on the rise. In July, import from the EU of electro-mechanical products reached 73.42 billion yuan, down 2.9% YOY, accounting for 61.1% of total import value, including cars worth 14.16 billion yuan, up 10.8%; automotive parts worth 7.61 billion yuan, up 7.4%; and measurement/detection instruments worth 5.41 billion yuan, down 0.8%. In addition, import of pharmaceuticals reached 8.96 billion yuan, up 31.6%; agricultural products 8.79 billion yuan, up 7.3%.
China-EU Traded Goods List for July 2016
Ⅱ Notable Problems and Relevant Suggestions
(1) EU trade-protection measures are increasing against China’s exports. In June, the EU started double-anti investigations in China-made aluminum foil; imposed anti-dumping duties on cold-rolled steels from China; levied 64.3% ad valorem duty on molybdenum wire products from China; on July 29, European Commission decided to slap 18.4%-22.5% anti-dumping duties on China-made screw-thread steels. In addition, recently, the EU issued consumer warnings of 56 products like toys and electronics from China; also complained to the WTO that China still keeps export duties on 11 kinds of raw materials in violation of its commitment to the WTO. Increasing trade protection measures have got China's exports to the EU more and more difficult.
(2) Negative impacts from “Brexit” are emerging gradually and likely to slow down China-EU trade development. Reportedly, British exit from the EU will slow down European consumption, investment, and international trade. By estimate, this year Euro-zone GDP growth will be 1.5%-1.6%, lower than 1.7% predicted by EU spring economic report in July; by 2017, the “Brexit” would drag Euro-zone GDP down 0.25%-0.5%, along with adverse effect on China-EU trade.
(3) Frequent terrorist attacks are slowing down EU economic recovery, with China-EU trade under more uncertainties. On March 22, terrorist attacks broke out at Belgian airport and subway stations; on July 14, Nice in France also suffered terrorist attacks; in two weeks of late July, 4 terrorist attacks occurred in Germany. Faced with recent frequent terrorist attacks, investors and consumers are more and more worried about European security, and subsequent impacts will likely continue to expand and cause slump in European investment and consumption, thus harming EU economic recovery and trade activities with China.
Keywords:EUExport & Import
Related Articles:
- GACC Announcement No.55, 2017 on Preferential Measures for Wine Import via Hong Kong
(2017-11-13) - GACC Announcement No.53, 2017 on Zero Duty on Gambia & Sao Tome-Principe Products
(2017-11-10) - China’s Foreign Trade Up Fast YOY in Jan-Oct 2017
(2017-11-10) - Beijing’s Foreign Trade Up to RMB 1.61 TRLN in Jan-Sept 2017
(2017-11-06) - Zhejiang Province-BRICS Trade Up Fast in Jan-Aug 2017
(2017-11-01) - Shandong Imported Paper Pulps More in QTY & Price in Jan-Sept 2017
(2017-10-30) - GACC Announcement No.51, 2017 on Tax-Cut Imports Control Duration Updated
(2017-10-30) - Jiangsu Imported Soybeans, QTY Up & Price Down, in Aug 2017
(2017-10-24) - Lhasa Customs Statistics for January-September 2017
(2017-10-24) - Jiangsu Imported Beef & Mutton More in Aug 2017
(2017-10-23)