
Tibet Export-Import Value Down 12.97% in January 2018
[2018-04-09]
According to Lhasa Customs statistics, in January 2018, Tibet’s foreign-trade export and import totaled CNY 374 million, a decrease of 12.97% year-on-year (YOY). Therein, export value 277 million yuan, down 1.12%; import value 97 million yuan, down 35.24%; the surplus 180 million yuan.
Trade Characteristics:
Trade mode: frontier petty trade reached 217 million yuan, a decrease of 16.37% YOY, accounting for 58.02%; ordinary trade reached 153 million yuan, down 6.44%; border market exchange reached 2 million yuan, an increase of 2.1 times.
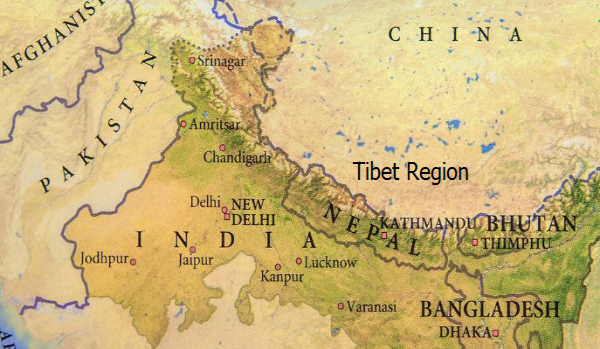
Trade partners: Tibet’s export-import trade with Nepal and the EU dropped by 16.01% and 57.1% respectively, while with the ASEAN and the USA rose by 7.89% and 2.58 times respectively.
Commodity composition: the exports of traditional labor-intensive products reached 181 million yuan, down 13.26%, accounting for 65.34%; therein, export textiles, footwear, and bags decreased by 6.98% and 34.11% and rose 18.83% respectively; import pharmaceutical products totaled 73 million yuan, down 37.84%, accounting for 75.26%.
Causes:
First, the monthly data was reduced because of holidays, the decrease of foreign trade participants, and the import and export volume of small-medium-sized enterprises significantly shrank, and there was a lack of stable trade support.
Second, the political election in Nepal had certain impact on the bilateral trade.
Trade Characteristics:
Trade mode: frontier petty trade reached 217 million yuan, a decrease of 16.37% YOY, accounting for 58.02%; ordinary trade reached 153 million yuan, down 6.44%; border market exchange reached 2 million yuan, an increase of 2.1 times.
Trade partners: Tibet’s export-import trade with Nepal and the EU dropped by 16.01% and 57.1% respectively, while with the ASEAN and the USA rose by 7.89% and 2.58 times respectively.
Commodity composition: the exports of traditional labor-intensive products reached 181 million yuan, down 13.26%, accounting for 65.34%; therein, export textiles, footwear, and bags decreased by 6.98% and 34.11% and rose 18.83% respectively; import pharmaceutical products totaled 73 million yuan, down 37.84%, accounting for 75.26%.
Causes:
First, the monthly data was reduced because of holidays, the decrease of foreign trade participants, and the import and export volume of small-medium-sized enterprises significantly shrank, and there was a lack of stable trade support.
Second, the political election in Nepal had certain impact on the bilateral trade.
Source: ETCN
Keywords:Tibet Export Import Value
Related Articles:
- Xiamen Imported Pork Less YOY in 2017
(2018-01-29) - Guangdong Imported Cereals, QTY Up & Price Down, in Jan-Sept 2017
(2017-12-18) - Guangdong Imported Edible Veg Oil, QTY Down & Price Up, in Jan-Sept 2017
(2017-12-07) - Hangzhou Export Up 3.8% in Jan-Oct 2017
(2017-11-29) - Guangdong Household-Appliances Export Up Slowly in Aug 2017
(2017-11-28) - Dalian Imported Corns Much Less in Jan-Aug 2017
(2017-11-27) - Tianjin Imported Iron Ore, QTY Down & Price Up, in Jan-Sept 2017
(2017-11-21) - Guangdong Automobile Export: QTY Up & Price Down in Aug 2017
(2017-11-16) - GACC Announcement No.55, 2017 on Preferential Measures for Wine Import via Hong Kong
(2017-11-13) - GACC Announcement No.53, 2017 on Zero Duty on Gambia & Sao Tome-Principe Products
(2017-11-10)