


China’s Export & Import Value Down for Jan-July 2016; Export Up and Import Down in July Only
[2016-08-17 15:28:47]
According to China Customs statistics:
Ⅴ The staple commodities like iron ore, crude oil and copper were imported more, with prices generally fallen.
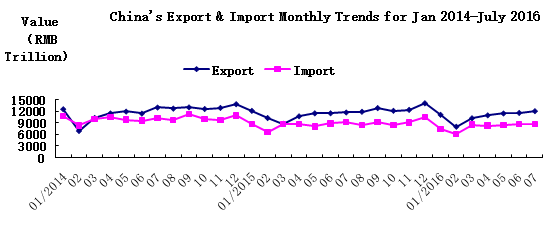
For the first seven months (Jan-July) of this year, China’s gross export-import value reached RMB13.21 trillion yuan, down 3% year-on-year (YOY). Therein, export value was 7.6 trillion yuan, down 1.6% YOY; import value 5.61 trillion yuan, down 4.8% YOY; trade surplus was 1.99 trillion yuan, expanding 8.7% YOY.
In July only, China’s export-import value totaled RMB2.09 trillion yuan, down 0.9% YOY. Therein, export value was 1.22 trillion yuan, up 2.9% YOY; import value 873 billion yuan, down 5.7% YOY; trade surplus was 342.8 billion yuan, expanding 34% YOY (as the chart below).
For January-July, China’s export and import showed the following characteristics:
Ⅰ The mode of ordinary trade took bigger share in export and import.
For January-July, the export-import value by ordinary trade reached 7.47 trillion yuan, down 0.7% YOY, accounting for 56.5% of gross value which rose by 1.3 percentage points YOY. Therein, export value was 4.24 trillion yuan, up 0.8% YOY, accounting for 55.7% of total export; import value 3.23 trillion yuan, down 2.6% YOY, accounting for 57.6% of total import; trade surplus 1.01 trillion yuan, expanded by 13.6% YOY.
Over the same period, the mode of processing trade got export and import totaling 3.82 trillion yuan, down 9.2% YOY, accounting for 28.9% of gross value which dropped by 2 percentage points YOY. Therein export value was 2.47 trillion yuan, down 7.8% YOY, accounting for 32.5% of total export; import value 1.35 trillion yuan, down 11.7% YOY, accounting for 24% of total import; processing trade surplus was 1.12 trillion yuan, narrowed by 2.7% YOY.
Additionally, in the mode of Customs special control, export and import totaled 1.42 trillion yuan, down 1.2% YOY, accounting for 10.7% of gross value. Therein, export value was 504.76 billion yuan, down 2.3% YOY, accounting for 6.6% of total export; import value 914.04 billion yuan, down 0.6% YOY, accounting for 16.3% of total import.
Ⅱ Trade increased with European Union and Japan while fell with the United States and the ASEAN.
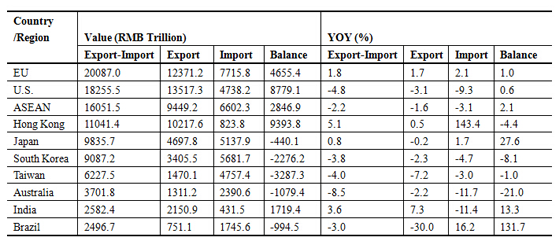
During first seven months, the EU was China's first largest trading partner: bilateral trade totaling 2.01 trillion yuan, up 1.8% YOY, accounted for 15.2% of gross value. Therein, export to the EU reached 1.24 trillion yuan, up 1.7% YOY; import from the EU reached 771.58 billion yuan, up 2.1% YOY; China’s trade surplus 465.54 billion yuan, expanded by 1% YOY.
The United States was China's second largest trading partner: bilateral trade amounted to 1.83 trillion yuan, down 4.8% YOY, accounting for 13.8% of gross value. Therein, export to the U.S. reached 1.35 trillion yuan, down 3.1% YOY; import from the U.S. reached 473.82 billion yuan, down 9.3% YOY; China’s trade surplus 877.91 billion yuan, expanded by 0.6% YOY.
Meanwhile, the ASEAN was China's third largest trading partner: bilateral trade amounted to 1.61 trillion yuan, down 2.2% YOY, accounting for 12.2% of gross value. Therein, export to ASEAN reached 944.92 billion yuan, down 1.6% YOY; import from ASEAN reached 660.23 billion yuan, down 3.1% YOY; trade surplus 284.69 billion yuan, expanded by 2.1% YOY.
Japan was China's fifth largest trading partner: Sino-Japanese trade amounted to 983.57 billion yuan, up 0.8% YOY, accounted for 7.4% of gross value. Therein, export to Japan reached 469.78 billion yuan, down 0.2% YOY; import from Japan reached 513.79 billion yuan, up 1.7% YOY; trade deficit was 44.01 billion yuan, expanded by 27.6% YOY. (see Table 1).
Table 1: Export & Import Value between China and Major Trading Partners for Jan-July
Ⅲ Private enterprises increased in export and import, higher in trade proportion.
From January to July, China’s private enterprises made export and import totaling 5.12 trillion yuan, up 4.8% YOY, accounting for 38.8% of gross value which was higher by 2.9 percentage points YOY. Therein, export value was 3.55 trillion yuan, up 3.6% YOY, accounting for 46.7% of total export; import value 1.57 trillion yuan, up 7.6% YOY, accounting for 27.9% of total import.
Over the same period, foreign-invested enterprises made export and import worth 5.98 trillion yuan, down 6.1% YOY, accounting for 45.3% of gross value. Therein, export value was 3.25 trillion yuan, down 5.6% YOY, accounting for 42.8% of total export; import value 2.73 trillion yuan, down 6.6% YOY, accounting for 48.6% of total import.
Additionally, state-owned enterprises made export and import totaling 2.05 trillion yuan, down 12% YOY, accounting for 15.5% of gross value. Therein, export value was 789.87 billion yuan, down 6.8% YOY, accounting for 10.4% of total export; import value 1.26 trillion yuan, down 14.9% YOY, accounting for 22.5% of total import.
Ⅳ Decline in export of electromechanical products, while increase in export of textiles and some other traditional labor-intensive products.
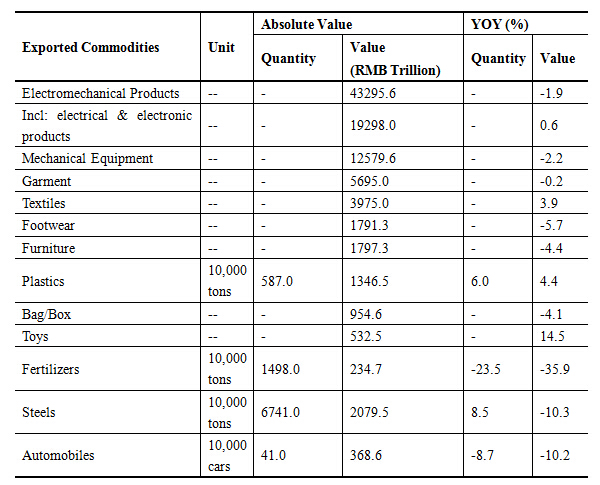
Over the first seven months, export of electromechanical products reached 4.33 trillion yuan, down 1.9% YOY, accounting for 57% of total export. Therein, exported electrical and electronic products amounted to 1.93 trillion yuan, up 0.6% YOY; exported mechanical equipment amounted to 1.26 trillion yuan, down 2.2% YOY. Meanwhile, garment export reached 569.5 billion yuan, down 0.2% YOY; textile export reached 397.5 billion yuan, up 3.9% YOY; footwear export 179.13 billion yuan, down 5.7% YOY; furniture export 179.73 billion yuan, down 4.4% YOY; plastics export 134.65 billion yuan, up 4.4% YOY; bag/box export 95.46 billion yuan, down 4.1% YOY; toy export 53.25 billion yuan, up 14.5% YOY; the seven kinds of labor-intensive products totaled 1.61 trillion yuan, up 0.2% YOY, accounting for 21.2% of total export. Besides, fertilizer export reached 14.98 million tons, down 23.5% YOY; steels export 67.41 million tons, up 8.5% YOY; automobile export 410,000 cars, down 8.7% YOY (see Table 2).
Table 2: Exported Commodities Statistics for Jan-July
Ⅴ The staple commodities like iron ore, crude oil and copper were imported more, with prices generally fallen.
Over January-July, import of iron ore reached 582 million tons, up 8.1% YOY, with average import price 337.6 yuan per ton, down 13.3% YOY; import of crude oil reached 218 million tons, up 12.1%, average import price 1,852.1 yuan per ton, down 29.6% YOY; coal import 129 million tons, up 6.7% YOY, average import price 315.3 yuan per ton, down 18.8% YOY; import of refined oil 17.55 million tons, down 3.4% YOY, average import price 2,475.8 yuan per ton, down 20.3% YOY; import of primary-form plastics 14.37 million tons, down 6% YOY, average import price 10,300 yuan per ton, down 4.4% YOY; steels import 7.59 million tons, down 1.4% YOY, average import price 6,471.2 yuan per ton, down 9.4% YOY; import of unwrought copper reached 3.09 million tons, up 19.5% YOY, average import price 33,700 yuan per ton, down 14.9% YOY.
Moreover, imported electromechanical products totaled 2.71 trillion yuan, down 1.7% YOY, including 570,000 cars, down 9.9% YOY (see Table 3).
Table 3: Imported Commodities Statistics for Jan-July
Ⅵ China's export leading index rebounded in July.
China's export leading index was 33.8 for July, up by 1.1 month-on-month, signaling light pressure on export in early fourth quarter. As revealed by an online questionnaire survey, China’s July Export Management Index reached 36.9, up by 1.0 MOM; New Export Order Index rose by 0.9 MOM to 36.3, and Export Managers Confidence Index rose by 2.2 to 42.4, while Export Enterprises Comprehensive Cost Index dropped by 1.0 to 28.0.
Source: Authored by the Department of Statistics, the General Administration of Customs of the P. R. China
Keywords:China’s Export & Import Value

Related Articles:
- GACC Announcement No.36, 2016 on (Bonded Control of Imports for Int’l Service Outsourcing Industry)
(2016-06-20) - GACC Announcement No.26, 2016 on (Cross-Border E-Commerce Retail Import/Export Control)
(2016-05-10) - GACC Announcement No.20, 2016 on (Revised Specifications on Import/Export Declaration Form)
(2016-05-10) - GACC Announcement No.10, 2016 on (Additions & Adjustments to Import & Export Tariff of 2016)
(2016-03-04) - GACC-MOFCOM Announcement No.5, 2016 on (Automatic Import License Paperless Clearance)
(2016-03-04) - PBOC-GACC Announcement No.44, 2015 on (Gold & Gold Product Export/Import)
(2016-02-18) - GACC Announcement No.50, 2015 on (More Ports in Customs Conveniences for Wine Import via Hong Kong)
(2015-10-26) - GACC Announcement No.48, 2015 (on Paperless Revision & Cancel of Import & Export Declarations)
(2015-10-21) - China Export Leading Index Still Down in August 2015
(2015-09-11) - China Export Leading Index Still Down in July 2015
(2015-08-10)
Most Read
- Cross-Straits Trade Deal to Cut Tariffs, Open Markets
(2010-06-30) - Solar Panel Duty on Chinese Imports 'Could Cost UK Billions'
(2013-02-21) - Sluggish Export of Steel to Ease Pressures of Tariff Adjustment in China
(2011-07-26) - Customs Interpretation on Implementation Plan of Tariff in 2009
(2009-03-24) - China Eases Tariffs to Boost Domestic Consumption
(2011-02-22) - Offcial of the Ministry of Finance Answers Questions Raised by Reporters Concern
(2010-01-04) - China to Eliminate Tax Rebates on Certain Export Goods
(2010-06-25) - China Cuts Tariffs on Baby Formula
(2013-01-30) - China Hails WTO Ruling Against EU Duties
(2011-07-18) - Owners of Petrochemical Industry Appeal to Authorities to Negotiate Zero Tariff
(2009-03-09)
Related Photos
 |
China's Investigation of European Wine not Retaliation: Spokesperson |
 |
Ukraine Car Import Tax to Affect Chinese Makers |
 |
China Says U.S. Measures on Shrimps against WTO Rules |
 |
China Cuts Tariffs on Baby Formula |
 |
European Court Ruling Boost Chinese Entrepreneurs' Confidence: MOC |
 |
MOFCOM Comments on WTO Appellate Body Report on US's Complaint against China's Anti-dumping and Anti-subsidy Measures on GOES Imports |
 |
MOFCOM Spokesman Shen Danyang Comments on U.S. Final Ruling of Antidumping and Antisubsidy Investigation against Imports of Chinese Solar Cells |
 |
US Self-harming Tariffs on China Solar Panels |
 |
China Unlikely to Cut Coke Export Duty, Say Most Coaltrans Participants |
