
China’s grain export falls and import kept steady in the first 3 quarters this y
[2008-12-29 16:39:43]
Source: www.customs.gov.cn
According to the statistical data from customs,
In the first 3 quarters of this year, the main features of
I. The export volume is high in the beginning and low at the end, the monthly year-on-year drop exceeds 50%. As influenced by the quota issuing progress, in the 1st quarter,
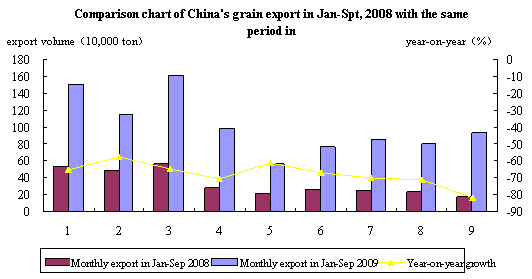
Monthly export in Jan-Sep 2008 Monthly export in Jan-Sep 2009 Year-on-year growth
II. General trade is the main mode of import and export trade. In the first three quarters of this year,
III. Asian area is the main export market, the main source of import is US and Brazil. In the first three quarters of this year,
Meanwhile, Chins has imported 10.39 million tons of grain from US, increased by 26%; and 10.38 million ton from
IV. The export of wheat and corn have dropped acutely, bean import has the dominant position, the import and export prices of various grain have increased by large margin. In the first three quarters of this year,
Quantity and price of main grain import and export in the first 3 quarters of
|
Commodity |
Export |
Import |
||||||
|
Quantity (10,000 ton) |
Year-on-year growth (%) |
Average (USD/ton) |
Year-on-year price growth (%) |
Quantity (10,000 ton) |
Year-on-year growth (%) |
Average (USD/ton) |
Year-on-year price growth (%) |
|
|
Corn |
18.7 |
-95.9 |
281.8 |
60.9 |
1.7 |
64.5 |
366.1 |
18.3 |
|
Wheat |
27.2 |
-87.1 |
332.5 |
58.5 |
0.9 |
-90.4 |
649.7 |
138.3 |
|
Paddy and rice |
82.7 |
-3.4 |
475.4 |
27.1 |
24.8 |
-25.6 |
606.0 |
30.9 |
|
Bean |
36.0 |
-1.1 |
757.1 |
86.2 |
2869.5 |
32.3 |
609.1 |
79.5 |
It worth noticing that, in 2005-2007, the grain planting area in
Suggestion (omitted)
[1] Analysis on investment opportunity under policy control of agriculture, forestry, pasturing and fishing http://www.toipo.com/view.php?content_id=301
